SMCCCD Enrollment, Faculty & Revenue Trends Over Last Decade
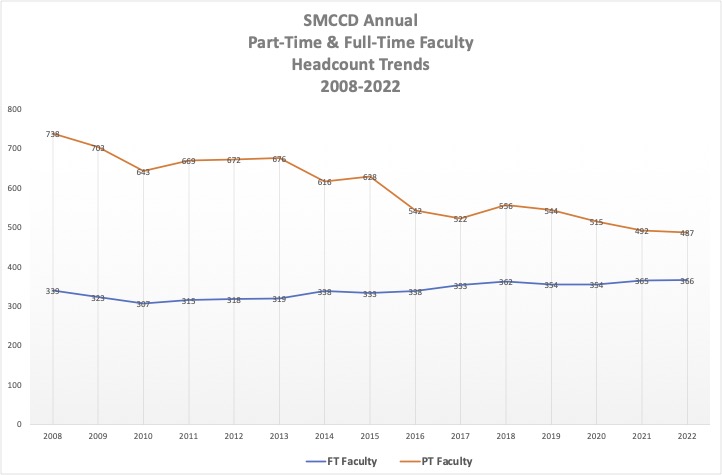
Over the last decade or so, our district enrollment has declined significantly as have our number of part-time faculty. The number of full-time faculty has increased by about a dozen over the same period. Meanwhile our district’s annual revenues have risen dramatically, from $113.8 million in 2009-10 to $208.2 million in 2019-20.
SMCCCD Annual Enrollment Trends
(2012-13 to 2021-22)
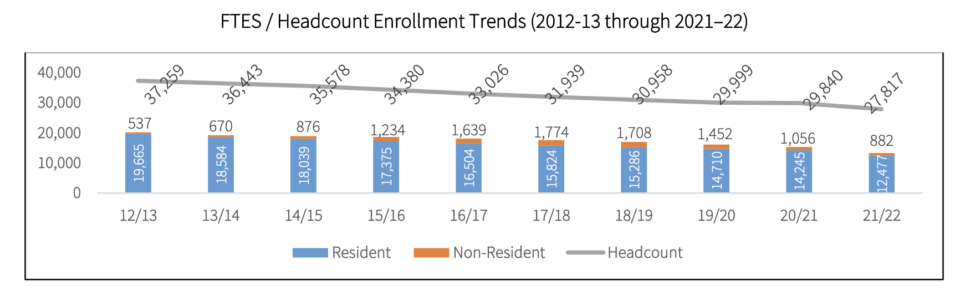 from: SMCCD 2021-2022 Final Budget Report (p.15)
SMCCCD Annual
Part-Time & Full-Time Faculty
Headcount Trends
2008-2022
FT PT
2008: 339 738
2009: 323 703
2010: 307 643
2011: 315 669
2012: 318 672
2013: 319 676
2014: 338 616
2015: 333 628
2016: 338 542
2017: 353 522
2018: 362 556
2019: 354 544
2020: 354 515
2021: 365 492
2022: 366 487
from: California Community Colleges Chancellor’s Office Data Mart
SMCCCD Annual Revenues
2011-12 to 2021-22
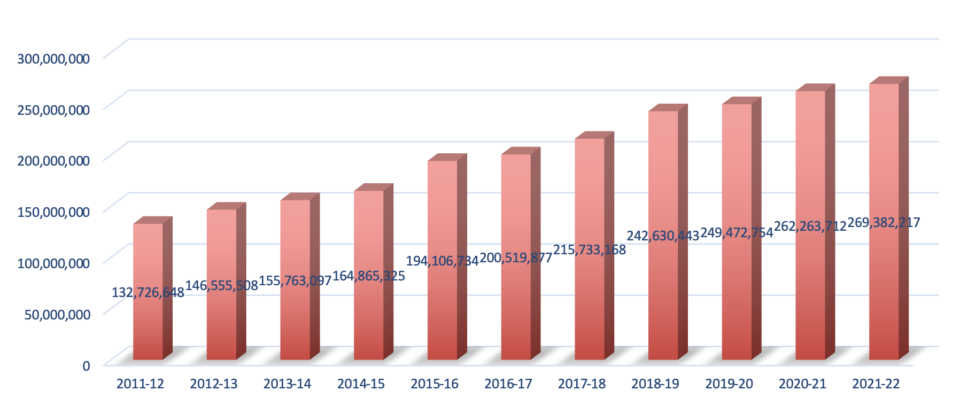
| Year | Revenues | % Increase |
| 2011-12 | $132,726,648 | |
| 2012-13 | $146,555,508 | 10.4% |
| 2013-14 | $155,763,097 | 6.3% |
| 2014-15 | $164,865,325 | 5.8% |
| 2015-16 | $194,106,734 | 17.7% |
| 2016-17 | $200,519,877 | 3.3% |
| 2017-18 | $215,733,168 | 7.6% |
| 2018-19 | $242,630,443 | 12.5% |
| 2019-20 | $249,472,754 | 2.8% |
| 2020-21 | $262,263,712 | 5.1% |
| 2021-22 | $269,382,217 | 2.7% |
Percentage revenue increase in last 10 years (from 2011-12 to 2021-22): 103%
from: CCFS-311 Reports (Total-Fund 10: Actual)