SMCCD Enrollment, Faculty & Revenue
Trends Over Last Decade
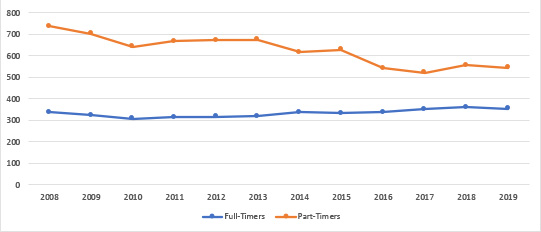
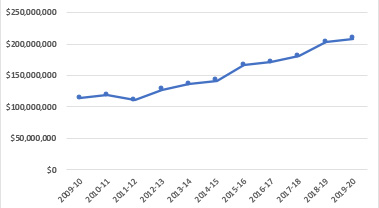
Over the last decade or so, our district enrollment has declined significantly as have our number of part-time faculty. The number of full-time faculty has increased by about a dozen over the same period. Meanwhile our district’s annual revenues have risen dramatically, from $113.8 million in 2009-10 to $208.2 million in 2019-20.
SMCCD Annual Enrollment Trends
(2011 – 2020)
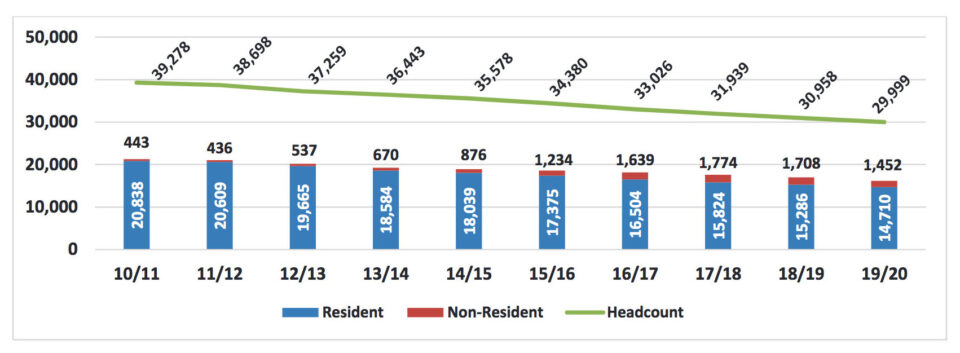
from: SMCCD 2020-2021 Final Budget Report (p.18)
SMCCD Annual
Part-Time & Full-Time Faculty
Headcount Trends
2008-2019
FT PT
2008: 339 738
2009: 323 703
2010: 307 643
2011: 315 669
2012: 318 672
2013: 319 676
2014: 338 616
2015: 333 628
2016: 338 542
2017: 353 522
2018: 362 556
2019: 354 544
from: California Community Colleges Chancellor’s Office Data Mart
SMCCD Annual Revenues
2009-10 to 2019-20
| Year | Revenues |
| 2009-10 | $113,826,726 |
| 2010-11 | $118,163,257 |
| 2011-12 | $110,904,919 |
| 2012-13 | $127,520,416 |
| 2013-14 | $135,790,198 |
| 2014-15 | $141,694,473 |
| 2015-16 | $166,502,653 |
| 2016-17 | $170,906,514 |
| 2017-18 | $180,413,368 |
| 2018-19 | $202,864,193 |
| 2019-20 | $208,282,993 |
from: CCCCO CCFS-311 Reports